When Injury Management Software Generates Wrong Reports
Injury management software plays a pivotal role in ensuring safety and effici...
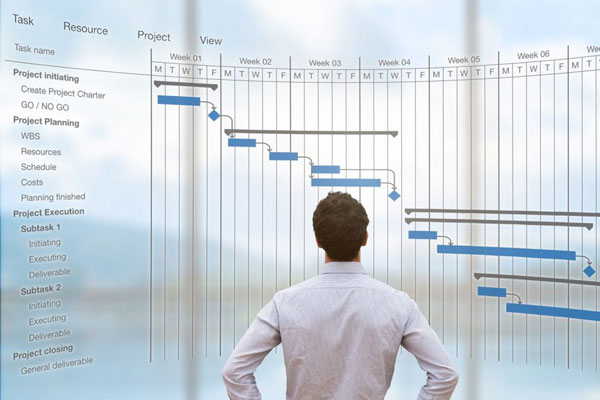
The problem with construction project scheduling is that you need to be extremely precise if you want to deliver your project within budget and on time. Although there are many phases of the construction project, variables overcomplicate each phase and attempting to oversee the whole project becomes immensely difficult. Project managers have to juggle multiple tasks, various timelines, different crews, general contractors and subcontractors in order to complete the deliverables. Thankfully, there are many management tools that can assist you with project management, making job scheduling a little bit simpler. Such management tools help you visualise the overall timeline of the project, allowing you to make plans and schedules so that you can stay on top of all your deliverables and variables. Out of these management tools, the Gantt chart is one of the more popular ones. Let us discuss everything that you need to know about Gantt charts.
If we go into the technical definition, the Gantt chart can be described as a type of bar chart which helps you visualise the project schedule by illustrating the different types of dependency relationships between the current schedule status and activities. In simpler words, the Gantt chart can be described as a visual representation of all tasks placed against the timeline of the construction project. Gantt charts help to display important information, such as the estimated duration of tasks, who is assigned to what task and overlapping activities within the project plan.
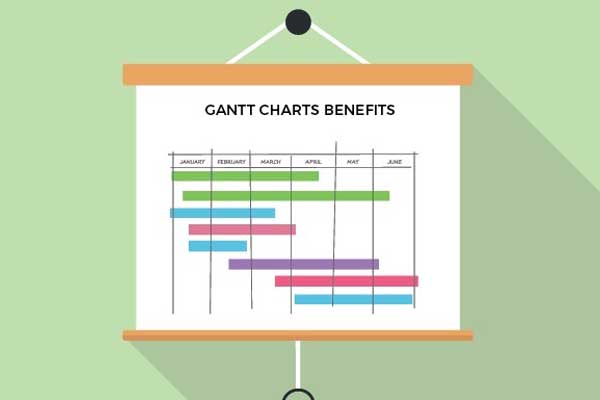
When we are talking about construction project schedules, you have to remember that there are different phases and milestones that need to be accounted for through proper monitoring. That is why the illustrative elements in a Gantt chart become so attractive. When an individual sees the overall progress of different tasks during the construction process, it becomes easier for them to visualise the remaining timeline. Moreover, Gantt charts prove to be incredibly beneficial in areas such as:

In fact, visualising project progress at a glance is one of the biggest advantages of Gantt charts. Since there are several different bar charts that exist in a single desktop view, it makes it simpler to prioritise as well as identify overlaps or redundancies. Additionally, since all critical data is displayed in the simplest of terms, it makes it easy to understand what is needed to be done, helping to categorise the task groups and to bring all team members on the same page.
Also read: “Time Management In Construction”
One of the biggest advantages of construction scheduling software is that the usage Gantt chart can be customised so that they become suitable for projects of different sizes. Such software programs easily show aspects such as task dependencies, start-to-end dates, order of task progress, trackers, and much more. The benefits of using construction schedule software include the following:
Gantt Charts are helpful as they help you visualise the entire timeline of the project, allowing you to plan the order of execution, understand the dependencies between tasks, determine which resources are needed and assess how long a project may take. Having a daily construction timesheet to control your plans can help you.
 Jun.15
Injury management software plays a pivotal role in ensuring safety and effici...
 Jun.15
Maintaining high construction quality standards is a bit like building a hous...
 Jun.15
The use of construction apps has revolutionised how projects are managed, off...
 Jun.15
Digital timesheets have emerged as a key tool in construction project managem...
 Jun.08
Injury management software is a transformative tool for construction companie...
 Jun.08
ICAM, or Incident Cause Analysis Method, investigations are a vital part of u...
 Jun.08
Construction sites rely heavily on software dashboards to keep everything run...
 Jun.01
Injury management reports are vital in construction. They’re the bridge...
Comments